How to use the SUMMARIZE Function to Summarize data Group By specific Columns in Power BI DAX

 Note :
In the above table, the Measure [NetSales] is calculated using the below DAX Expression.
TotalSales = SUMX(FactSales,FactSales[Units_Sold]*RELATED(DimProducts[Unit_Price]))

The SUMMARIZE Function in Power BI DAX is used to create a Summary Table from the Fact Table, and data will be Grouped by the specific columns from the related Dimension Tables or from the same Fact Table.
Scenario :
Suppose we have our Power BI Data Model as follows..

Now from the above Data Model, we can have a Tabular Report with Sales details as below

In the above table, the Measure [NetSales] is calculated using the below DAX Expression.
TotalSales = SUMX(FactSales,FactSales[Units_Sold]*RELATED(DimProducts[Unit_Price]))
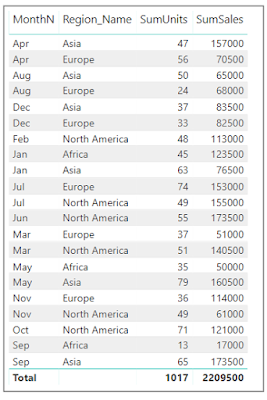
Now from the above Sales details table, we can prepare a Sales Summary table, with data Group By columns MonthN, Region_Name, using the below DAX Expression :
SalesSummary =
SUMMARIZE(FactSales, DimRegion[Region_Name], FactSales[MonthN],
"SumSales", SUMX(FactSales,FactSales[TotalSales]),
"SumUnits", SUM(FactSales[Units_Sold]))
Note :
Since the measure [TotalSales] is not a Direct Measure of FactTable, I have used the SUMX Function instead of SUM Function.
Result :

--------------------------------------------------------------------------------------------------------
Thanks, TAMATAM ; Business Intelligence & Analytics Professional
--------------------------------------------------------------------------------------------------------
No comments:
Post a Comment
Hi User, Thank You for visiting My Blog. If you wish, please share your genuine Feedback or comments only related to this Blog Posts. It is my humble request that, please do not post any Spam comments or Advertising kind of comments, which will be Ignored.