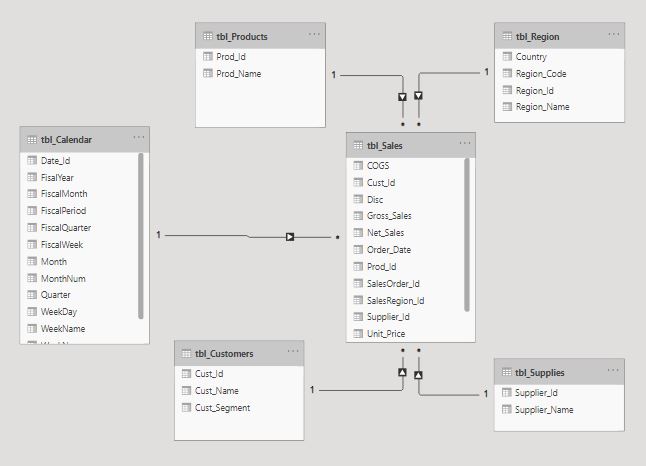
Suppose we have the Data Model as follows:
We have the sample Sales data by Year and Product as follows:

Scenario:
Now we want to calculate the Top 3 Sales by Product per year from the above data. Also, the Sales which does not falls in Top 3 needs to group and show in a new row as "Others".This can be done using the following DAX Table Expression:
Top3Sales Summary = GENERATE(
SUMMARIZE( tbl_Sales, tbl_Calendar[FisalYear]),
VAR Top3Products=TOPN(3,
ADDCOLUMNS(VALUES(tbl_Products[Prod_Name]),"@Amt", [Total Sales]),[@Amt])
VAR Top3ProdRanked=ADDCOLUMNS(Top3Products,"@Pos",RANKX(Top3Products,[@Amt],,DESC))
VAR SalesAllProducts=[Total Sales]
VAR SalesTopThree=SUMX(Top3Products,[@Amt])
VAR SalesOthers=(SalesAllProducts-SalesTopThree)
VAR RowOthers={("Others",SalesOthers,4)}
VAR Result=UNION(Top3ProdRanked,RowOthers)
RETURN Result
)
Notes:
here, [Total Sales]=SUM(tbl_Sales[Net_Sales])
Output:

Suppose if you simply wants to find the Top3 Sales by Product, you can find using the below DAX Expression :
Top3 Sales by Prod = TOPN(3, SUMMARIZE(tbl_Sales,tbl_Calendar[FiscalQuarter],tbl_Products[Prod_Name],"@Sales",[Total Sales]),[@Sales],DESC)
Result:

Thanks, Tamatam
No comments:
Post a Comment
Hi User, Thank You for visiting My Blog. If you wish, please share your genuine Feedback or comments only related to this Blog Posts. It is my humble request that, please do not post any Spam comments or Advertising kind of comments, which will be Ignored.