The Python provides the Openpyxl package, which has several modules helps to work with the Excel files. By using these modules, we can perform excel tasks such as read data from excel file, or write data to the excel file, draw some charts, accessing excel sheet, renaming sheet, modifying the data in sheet and formatting, styling in the sheet, and other tasks.
The Openpyxl is a very efficient package to work with the .xlsx version of files.
In the following examples, we will look at, creating an Excel file, writing data, reading the data, appending data, processing data and other operations on Excel using the Openpyxl library.
List of Packages(or Modules) used in the following examples:
import sys
import os
import openpyxl
import pandas as pd
from openpyxl.drawing.image import Image
from openpyxl.styles import Font
from openpyxl.styles import PatternFill
from openpyxl.utils import get_column_letter, get_column_interval
# ------------------------------------------------------------------------------------------------------------------------ #
Quick notes on the related Packages/Modules:
# sys : The sys module provides the functions and variables which are used to manipulate the different parts of the Python Runtime Environment.
# os : The OS module in python provides functions for interacting with the operating system. It comes under Python’s standard utility modules. This module provides a portable way of using operating system dependent functionality.
# Pandas : The Pandas is one of the powerful open source libraries in Python programming language used for data analysis and data manipulation.
# openpyxl : A Package to work (reading and writing data) with Excel 2010 files (ie: .xlsx)
# xlutils : A Package with combined features of the packages 'xlrd' and 'xlwt' to work with the old version)(.xls) files.
# xlsxwriter : A Package for writing data, formatting information and charts in the Excel 2010 format (ie: .xlsx)
# pillow : A Package to work with images, using the PIL(Python Image Library).
# ------------------------------------------------------------------------------------------------------------------------ #
Examples:
# ------------------------------------------------------------------------------------------------------------------------ #
Defining the folder and file path variables:
folder_path = 'C:\\Users\\write\\PycharmProjects\\pythonProject\\PyLab1\\File_Operations\\Input\\'
xlFile_name = "xlSample_Input.xlsx"
xlFile = folder_path + xlFile_name
These variables will used further in the following while to create, open, read and write data to excel file.
The directory/folder of your target file may be different from your default Python working folder.
Due to this we need to specify the file and folder path variables for the further reference.
Lets find and print the paths of the current working directory of the Python file and the Excel files.
# Current working Python File name
print('The current working Python File name:\n', os.path.basename(__file__))
# Current working Python File directory
print('The current working Python File Directory name:\n', os.path.dirname(__file__))
print('The current working Python File Directory name:\n', os.getcwd())
# Result:
The current working Python File name:
Lab1.py
The current working Python File Directory name:
C:\Users\write\PycharmProjects\pythonProject\PyLab1
# Current working Excel File name
print('The Excel File name:\n', os.path.basename(xlFile))
# Current working Excel File directory
print('The Excel File Directory Name:\n', os.path.dirname(xlFile))
# Current working Excel File full path
print('The full path of the Excel File:\n', os.path.abspath(xlFile))
# Result:
The Excel File name:
xlSample_Input.xlsx
The Excel File Directory name:
C:\Users\write\PycharmProjects\pythonProject\PyLab1\File_Operations\Input
The full path of the Excel File:
C:\Users\write\PycharmProjects\pythonProject\PyLab1\File_Operations\Input\xlSample_Input.xlsx
# ------------------------------------------------------------------------------------------------------------------------ #
Creating a xlsx file in the given Path defined in above section:myWB = openpyxl.Workbook()
myWB.save(xlFile)
myWB.close()
# Output:

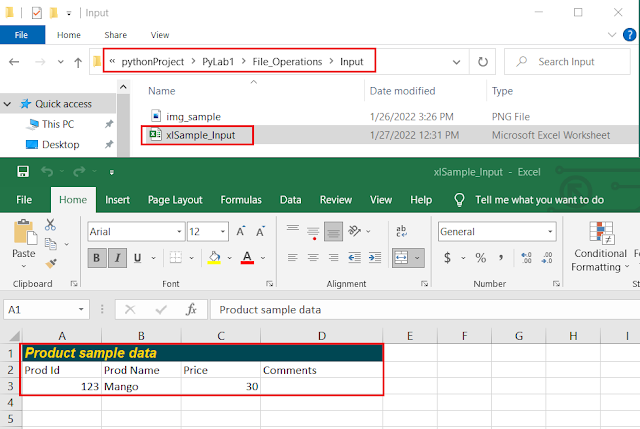
Opening an existing Excel file and defining Title and Columns of the Data:
myWB = openpyxl.load_workbook(xlFile)# Assigning the active sheet to a variable (sheet object)
sht1 = myWB.active
# The first row or column number begins with 1, not 0. Cell object is created by using sheet object's cell() method.
r1c1 = sht1.cell(row=1, column=1)f
#str1 = input('Please enter the sample data title: ')
# Defining and passing the Title for the data in first row of the active sheet
str1 = 'Product sample data'
sht1.merge_cells('A1:D1') # Merging the cells
sht1["A1"] = str1
# Formatting the title string
sht1["A1"].font = Font(name='Arial', size=12, bold=True, italic=True, color='ffd700')
sht1['A1'].fill = PatternFill(start_color="004753", fill_type="solid")
str1 = 'Product sample data'
sht1.merge_cells('A1:D1') # Merging the cells
sht1["A1"] = str1
# Formatting the title string
sht1["A1"].font = Font(name='Arial', size=12, bold=True, italic=True, color='ffd700')
sht1['A1'].fill = PatternFill(start_color="004753", fill_type="solid")
Defining and passing the Column names in second row of the active sheet:
a2 = sht1.cell(row=2, column=1) # a2=sht1['A2']
b2 = sht1.cell(row=2, column=2) # b2=sht1['B2']
c2 = sht1.cell(row=2, column=3) # c2=sht1['C2']
a2.value = 'Prod Id'
b2.value = 'Prod Name'
c2.value = 'Price'
a2 = sht1.cell(row=2, column=1) # a2=sht1['A2']
b2 = sht1.cell(row=2, column=2) # b2=sht1['B2']
c2 = sht1.cell(row=2, column=3) # c2=sht1['C2']
a2.value = 'Prod Id'
b2.value = 'Prod Name'
c2.value = 'Price'
# Adjusting the data Columns width(Autofit)
for i in range(1, sht1.max_column+1):
sht1.column_dimensions[get_column_letter(i)].bestFit = True
sht1.column_dimensions[get_column_letter(i)].auto_size = True
sht1['D2'].value = 'Comments' # adding the comments column
sht1.column_dimensions['D'].width = 20 # static way of column sizing
for i in range(1, sht1.max_column+1):
sht1.column_dimensions[get_column_letter(i)].bestFit = True
sht1.column_dimensions[get_column_letter(i)].auto_size = True
sht1['D2'].value = 'Comments' # adding the comments column
sht1.column_dimensions['D'].width = 20 # static way of column sizing
Writing/ Adding first record to the data at third row of the sheet using the either of the following methods:
#Method 1:
sht1.cell(row=3, column=1).value = '123' # a3=sht1['A3']
sht1.cell(row=3, column=2).value = 'Mango' # b3=sht1['B3']sht1.cell(row=3, column=1).value = '123' # a3=sht1['A3']
sht1.cell(row=3, column=3).value = 30 # c3=sht1['C3']
#Method 2:
sht1['A3'].value = 123
sht1['B3'].value = 'Mango'
sht1['C3'].value = 30
#Method 3:
a3 = sht1.cell(row=3, column=1) # a3=sht1['A3']
b3 = sht1.cell(row=3, column=2) # b3=sht1['B3']
c3 = sht1.cell(row=3, column=3) # c3=sht1['C3']
a3.value = 123
b3.value = 'Mango'
c3.value = 30
myWB.save(xlFile) # saving the excel file
# Output:
Appending data from a tuple / list to the existing Excel sheet:
# Appending data from a tuple
ds1 = ((124, 'Apple', 45),
(125, 'Banana', 10),
(126, 'Orange', 35)
)
for k in ds1:
sht1.append(k)
# Appending data from a list
lst1 = [[127, 'Grapes', 150.45],
[128, 'Blueberry', 275],
[129, 'Strawberry', 300.75]]
for k in lst1:
sht1.append(k)
# Output:

Adding an image to an existing Excel sheet:
img_name = 'img_sample.png'
img = Image(folder_path+img_name)
# Resizing the image
img.height = 150
img.width = 150
sht1.add_image(img, "E2")
# Renaming the active sheet
sht1.title = 'myData'
# adding a new sheet to this workbook
myWB.create_sheet("Analysis", 2)
# Printing all the sheets in this workbook
print('The available sheets in the Workbook are:\n ', myWB.sheetnames)
myWB.save(xlFile) # saving the excel workbook
myWB.close() # closing the excel workbook
# Output:
The available sheets in the Workbook are:
['myData', 'Analysis']

Opening and reading data from an existing workbook:
wb_obj = openpyxl.load_workbook(xlFile)
sht_obj = wb_obj.active
last_col = sht_obj.max_column
last_row = sht_obj.max_row
# Print the no.of columns and rows in the data
print('There are {0} rows and {1} columns in the data.'.format(last_row, last_col))
# Result:
There are 9 rows and 4 columns in the data.
# Print all column names from the active sheet
print('The columns names of the active sheet are:')
for k in range(1, last_col + 1):
cell_obj = sht_obj.cell(row=2, column=k)
print(cell_obj.value)
# Result:
The columns names of the active sheet are:
Prod Id
Prod Name
Price
Comments
# Print all values from the first column of active sheet
print('The values from the first column of the dataset are:')
for k in range(1, last_row-1):
cell_obj = sht_obj.cell(row=k+1, column=2)
print(cell_obj.value)
# Result:
The values from the first column of the dataset are:
Prod Name
Mango
Apple
Banana
Orange
Grapes
Blueberry
# Print all values from the first row of active sheet
print('The values from the first data row of the dataset are:')
for k in range(1, last_col + 1):
cell_obj = sht_obj.cell(row=3, column=k)
print(cell_obj.value)
# Result:
The values from the first data row of the dataset are:
123
Mango
30
None
# Print all values from the dataset of active sheet
print('The data from the dataset of active sheet:')
for row in sht_obj.iter_rows(min_row=2, min_col=1, max_row=last_row, max_col=last_col):
for cell in row:
print(cell.value, end=" ")
print()
# Result:
The data from the dataset of active sheet:
Prod Id Prod Name Price Comments
123 Mango 30 None
124 Apple 45 None
125 Banana 10 None
126 Orange 35 None
127 Grapes 150.45 None
128 Blueberry 275 None
129 Strawberry 300.75 None
# ------------------------------------------------------------------------------------------------------------------------ #
Creating a Dataframe/dataset from the data of active sheet :
So far we have mainly used the openpyxl package and its modules to process the data in the Excel. Now, we will use the Pandas package with openpyxl to create the data frames. We are using the Pandas package reference name 'pd ' in the following.
data_values = [ ] # an empty list will be used to store the data from excel
for row in sht_obj.iter_rows(min_row=2, min_col=1, max_row=last_row, max_col=last_col):
data_values.append([cell.value for cell in row])
# Creating the dataframe from the above list of values
df1 = pd.DataFrame(data_values, columns=get_column_interval(1, last_col))
print('The dataframe created from dataset is:\n', df1)
# Result:
The dataframe created from dataset is:
A B C D
0 Prod Id Prod Name Price Comments
1 123 Mango 30 None
2 124 Apple 45 None
3 125 Banana 10 None
4 126 Orange 35 None
5 127 Grapes 150.45 None
6 128 Blueberry 275 None
7 129 Strawberry 300.75 None
Notes:
As we know, in the dataframes, the row index will starts the from 0., which means, 0 refers to the first row of the dataset.
In the following example, header=1 means, it uses the second row for the column headers.
# Creating a Sub dataset from the dataset using the fist 3 columns 0, 1, 2 :
ds1 = pd.read_excel(xlFile, sheet_name='myData', skiprows=0, header=1, usecols=[0, 1, 2], na_values='Missing')
print('The subset of original dataset is:\n', ds1)
# Result:
The subset of original dataset is:
Prod Id Prod Name Price
0 123 Mango 30.00
1 124 Apple 45.00
2 125 Banana 10.00
3 126 Orange 35.00
4 127 Grapes 150.45
5 128 Blueberry 275.00
6 129 Strawberry 300.75
# Creating a Sub dataset from the dataset by passing the required Column names:
ds2 = pd.read_excel(xlFile, sheet_name='myData', skiprows=0, header=1, usecols=['Prod Name', 'Price'], na_values='Missing')
print('The subset of original dataset is:\n', ds2)
myWB.close() # finally, closing the workbook.
# Result:
The subset of original dataset is:
Prod Name Price
0 Mango 30.00
1 Apple 45.00
2 Banana 10.00
3 Orange 35.00
4 Grapes 150.45
5 Blueberry 275.00
6 Strawberry 300.75
#--------------------------------------------------------------Thanks--------------------------------------------------------------#


No comments:
Post a Comment
Hi User, Thank You for visiting My Blog. If you wish, please share your genuine Feedback or comments only related to this Blog Posts. It is my humble request that, please do not post any Spam comments or Advertising kind of comments, which will be Ignored.