FILTER Function in Power BI DAX
The FILTER Function is used to reduce the number of rows in the table that you are working with, and use only specific data in calculations. FILTER is not used independently, but as a function that is embedded in other functions that require a table as an argument.
Syntax :
FILTER(<table>,<filter>)
-- <Table> : The table to be filtered. The table can also be an expression that results in a table.
-- <Filter> : A Boolean expression that is to be evaluated for each row of the table.
For example, [Amount] > 0 or [Region] = "India"
Example :
Suppose we have data model as follows..

The Sales by Region , Country and Customer Segment as follows.

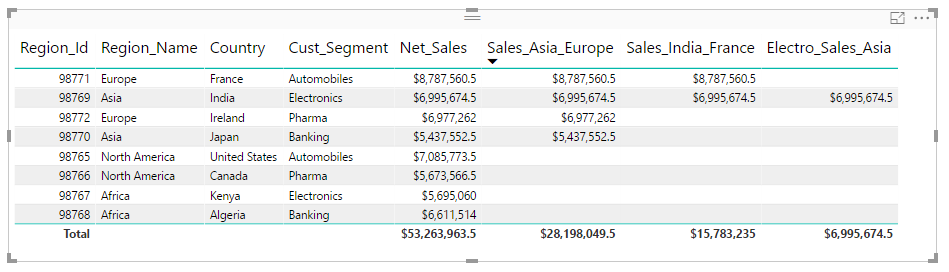
Calculating the Sum of Sales for ASIA and EUROPE Regions using FILTER Function as follows..
Sales_Asia_Europe =
CALCULATE(
SUM(FactSales[Net_Sales]),
FILTER(DimRegion,OR([Region_Name]="Asia" ,[Region_Name]="Europe"))
)
Result :

Calculating Sum of Sales for ASIA and EUROPE Regions and the Countries "India" and "France" using the Logical operators with FILTER Function as follows..
Sales_India_France =
CALCULATE(
SUM(FactSales[Net_Sales]),
FILTER(DimRegion,([Region_Name]="Asia"||[Region_Name]="Europe")
&& ([Country]="India" ||[Country]="France"))
)
Calculating Sum of Sales for ASIA Region and the Customer Segment "Electronics" using the multiple FILTER Functions as follows..
Electro_Sales_Asia =
CALCULATE(
SUM(FactSales[Net_Sales]),
FILTER(DimRegion,[Region_Name]="Asia"),
FILTER(DimCustomers,[Cust_Segment]="Electronics" )
)
Result :

Calculating Sum of Sales for specific Regions using RELATED Function with FILTER Functions as follows..here RELATED Function performs the lookup for the specified Region_Ids against the entire FactSales table and then SUM Function aggregates the corresponding values.
Lookup_Asia_Sales =
CALCULATE(
SUM(FactSales[Net_Sales]),
FILTER(FactSales,
OR(RELATED(DimRegion[Region_Id])=98769,
RELATED(DimRegion[Region_Id])=98770))
)
Result :

If we wants to show/repeat Asia_Sales for each regions, we need use ALL Function on the FactSales Table as shown below..
Lookup_Asia_Sales =
CALCULATE(
SUM(FactSales[Net_Sales]), FILTER(All(FactSales),OR(
RELATED(DimRegion[Region_Id])=98769,
RELATED(DimRegion[Region_Id])=98770))
)
Result :

The FILTER Function is used to reduce the number of rows in the table that you are working with, and use only specific data in calculations. FILTER is not used independently, but as a function that is embedded in other functions that require a table as an argument.
Syntax :
FILTER(<table>,<filter>)
-- <Table> : The table to be filtered. The table can also be an expression that results in a table.
-- <Filter> : A Boolean expression that is to be evaluated for each row of the table.
For example, [Amount] > 0 or [Region] = "India"
Example :
Suppose we have data model as follows..

The Sales by Region , Country and Customer Segment as follows.

Calculating the Sum of Sales for ASIA and EUROPE Regions using FILTER Function as follows..
Sales_Asia_Europe =
CALCULATE(
SUM(FactSales[Net_Sales]),
FILTER(DimRegion,OR([Region_Name]="Asia" ,[Region_Name]="Europe"))
)
Result :

Calculating Sum of Sales for ASIA and EUROPE Regions and the Countries "India" and "France" using the Logical operators with FILTER Function as follows..
Sales_India_France =
CALCULATE(
SUM(FactSales[Net_Sales]),
FILTER(DimRegion,([Region_Name]="Asia"||[Region_Name]="Europe")
&& ([Country]="India" ||[Country]="France"))
)
Calculating Sum of Sales for ASIA Region and the Customer Segment "Electronics" using the multiple FILTER Functions as follows..
Electro_Sales_Asia =
CALCULATE(
SUM(FactSales[Net_Sales]),
FILTER(DimRegion,[Region_Name]="Asia"),
FILTER(DimCustomers,[Cust_Segment]="Electronics" )
)
Result :
Calculating Sum of Sales for specific Regions using RELATED Function with FILTER Functions as follows..here RELATED Function performs the lookup for the specified Region_Ids against the entire FactSales table and then SUM Function aggregates the corresponding values.
Lookup_Asia_Sales =
CALCULATE(
SUM(FactSales[Net_Sales]),
FILTER(FactSales,
OR(RELATED(DimRegion[Region_Id])=98769,
RELATED(DimRegion[Region_Id])=98770))
)
Result :

If we wants to show/repeat Asia_Sales for each regions, we need use ALL Function on the FactSales Table as shown below..
Lookup_Asia_Sales =
CALCULATE(
SUM(FactSales[Net_Sales]), FILTER(All(FactSales),OR(
RELATED(DimRegion[Region_Id])=98769,
RELATED(DimRegion[Region_Id])=98770))
)
Result :

--------------------------------------------------------------------------------------------------------
Thanks, TAMATAM ; Business Intelligence & Analytics Professional
--------------------------------------------------------------------------------------------------------


No comments:
Post a Comment
Hi User, Thank You for visiting My Blog. If you wish, please share your genuine Feedback or comments only related to this Blog Posts. It is my humble request that, please do not post any Spam comments or Advertising kind of comments, which will be Ignored.