Scenario:
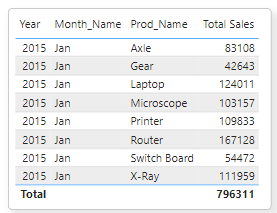
Suppose we have a Data Model as per below.


Requirement:
We need to find the dynamic Top N (say Top 3) Products based on the Total Sales, and the remaining of Total Sales other than Top N, has to show as Other Product Category (Others).By default the Product "Others" will not have any Sales value. Also, when all the Products are selected, then the value of "Others" will be Zero(0).

We can fulfill the above requirement, as discussed in below steps.
To achieve the above requirement, we need to add a "Others" Product in the Products table if it does not exist.
We can add the "Others" as a Product to tbl_Products table using Table.InsertRows function in Power Query.
let
Source = Excel.Workbook(File.Contents(DataSource), null, true),
Data_Sheet = Source{[Item="tbl_Products",Kind="Sheet"]}[Data],
PromoteHeaders = Table.PromoteHeaders(Data_Sheet, [PromoteAllScalars=true]),
RowsCount = Table.RowCount(PromoteHeaders),
InsertRows = Table.InsertRows(PromoteHeaders,
RowsCount,
{[Prod_Id=999999,Prod_Name="Others"]}),
ChangedType = Table.TransformColumnTypes(InsertRows,{{"Prod_Id", Int64.Type}, {"Prod_Name", type text}})
in
ChangedType

2) Create a TOPN Table for Slicer which will be using for Dynamic Selection of TopN
We can create a In Memory static table for TOPN Selection, using DATATABLE Function.

The FilterTopN table will be only using for Slicer, it does not required to link in the Model.
3) Create the required DAX Measures for TOPN Calculations:
Here, I am showing each Calculation in a different Measure only for our Understanding.
Total Sales = SUMX ( tbl_Sales, ( tbl_Sales[Unit_Price] * tbl_Sales[Units_Sold] ))
---------------------------------------------------------------------------Total Products Sales =
VAR vTotalProdSales = CALCULATE([Total Sales], ALL(tbl_Products))
RETURN
vTotalProdSales
---------------------------------------------------------------------------
Top N Products Sales =
VAR vNum = IF(HASONEVALUE(FilterTopN[Top N]),
SELECTEDVALUE(FilterTopN[Top N]),MAX(FilterTopN[Top N]))
VAR vTopProd = TOPN(vNum,
ALLSELECTED(tbl_Products),
[Total Sales],
DESC )
VAR vTopProdSales=CALCULATE( [Total Sales],KEEPFILTERS(vTopProd))
RETURN vTopProdSales
---------------------------------------------------------------------------
Top N Products Total Sales =
VAR vNum = IF(HASONEVALUE(FilterTopN[Top N]),
SELECTEDVALUE(FilterTopN[Top N]),MAX(FilterTopN[Top N]))
VAR vTopProd = TOPN(vNum,
ALLSELECTED(tbl_Products),
[Total Sales],
DESC )
VAR vTopProdTotalSales =CALCULATE( [Total Sales],vTopProd)
RETURN vTopProdTotalSales
---------------------------------------------------------------------------
% of Top N Product Sales =
DIVIDE([Top N Products Total Sales], [Total Products Sales])
---------------------------------------------------------------------------
Top N Selling Products =
VAR vNum = IF(HASONEVALUE(FilterTopN[Top N]),
SELECTEDVALUE(FilterTopN[Top N]),MAX(FilterTopN[Top N]))
VAR vTopProd= TOPN(vNum,
ALLSELECTED(tbl_Products[Prod_Name]),
[Total Sales],
DESC )
RETURN
CONCATENATEX(vTopProd,[Prod_Name],"|",[Total Sales], DESC )
---------------------------------------------------------------------------
Other Products Sales =
VAR vNum = 3
VAR vTotalProdSales = CALCULATE([Total Sales], ALL(tbl_Products))
VAR vTopProd = TOPN(3,
ALLSELECTED(tbl_Products),
[Total Sales],
DESC )
VAR vTopProdTotalSales =CALCULATE( [Total Sales],vTopProd)
VAR vOtherSales = (vTotalProdSales-vTopProdTotalSales)
RETURN vOtherSales
4) Add the Month and TopN Slicers and Visualize the Data
Now we can see the result of the above Measures for Top 3 Products per Month in a Table Visual as shown below.

Notes:
We can combine the logic of all the above Measures into one Measure and can see the result as per below:TopN_OtherProducts =
VAR vNum = IF(HASONEVALUE(FilterTopN[Top N]),
SELECTEDVALUE(FilterTopN[Top N]),MAX(FilterTopN[Top N]))
VAR vSelectProd = SELECTEDVALUE(tbl_Products[Prod_Name])
VAR vTotalProdSales = CALCULATE([Total Sales], ALL(tbl_Products))
VAR vTopProd = TOPN(vNum,
ALLSELECTED(tbl_Products),
[Total Sales],
DESC )
VAR vTopProdSales=CALCULATE( [Total Sales],KEEPFILTERS(vTopProd))
VAR vTopProdTotalSales =CALCULATE( [Total Sales],vTopProd)
VAR vOtherSales = (vTotalProdSales-vTopProdTotalSales)
VAR vResult = IF(vSelectProd="Others", vOtherSales,vTopProdSales)
RETURN
vResult
Output:

We can visualize the Top N Products sales on a Stacked Column Chart as shown below:

Notes:
We can create the dynamic custom Title and a Note using the below expressions:
Title1 = IF(HASONEVALUE(FilterTopN[Top N]),
"Top " & SELECTEDVALUE(FilterTopN[Top N]) &" Products & Others Sales",
"Top " & MAX(FilterTopN[Top N]) &" Products & Others Sales"
)
Note1 = IF(HASONEVALUE(FilterTopN[Top N]),
"( Top " & SELECTEDVALUE(FilterTopN[Top N]) & " Products Sales contributes to : "
& FORMAT([% of Top N Product Sales],"#.##%") & " of Total Sales: "&
[Total Products Sales] & " )",
"( Top " & MAX(FilterTopN[Top N]) & " Products Sales contributes to : "
& [% of Top N Product Sales] & " of Total Sales: "& [Total Products Sales] & " )"
)
https://excelkingdom.blogspot.com/2023/04/how-to-insert-new-records-to-table.html
https://excelkingdom.blogspot.com/2023/04/how-to-display-top-selling-products-per.html
https://excelkingdom.blogspot.com/2020/11/how-to-create-top-n-sales-summary-in.html
https://excelkingdom.blogspot.com/2018/11/how-to-dynamically-filter-top-n-based.html
--------------------------------------------------------------------------------------------------------
Thanks, TAMATAM ; Business Intelligence & Analytics Professional
--------------------------------------------------------------------------------------------------------


No comments:
Post a Comment
Hi User, Thank You for visiting My Blog. If you wish, please share your genuine Feedback or comments only related to this Blog Posts. It is my humble request that, please do not post any Spam comments or Advertising kind of comments, which will be Ignored.