The VertiPaq Engine is the heart of Power BI Data Model. It is a sophisticated in-memory data storage engine. Its primary role is to compress, store, and retrieve data efficiently for query execution.
The VertiPaq Engine is crucial for optimizing performance in Power BI and similar tools like Excel and Analysis Services.
The VertiPaq Engine consists of the following key components:
a) Formula Engine (FE):
This is the "brain" that processes your DAX queries. It interprets, calculates, and executes the logic defined in your formulas. While the Formula Engine handles complex calculations, it doesn't directly access data. Instead, it delegates data retrieval tasks to the Storage Engine.
b) Storage Engine (SE):
It acts as a warehouse, is responsible for retrieving data from the data model. It works closely with the VertiPaq Engine to ensure that data is stored efficiently and leveraging compression techniques to reduce memory usage.
These components work hand-in-hand to process queries and return results quickly, even for large datasets.
DAX Studio:
This is a powerful tool designed to work with Power BI, Excel, and Analysis Services. It helps users analyze, debug, and optimize their DAX (Data Analysis Expressions) queries.
VertiPaq Analyzer:
A feature embedded within DAX Studio, VertiPaq Analyzer provides a detailed breakdown of how data is stored and processed in Power BI's data model. By revealing storage statistics and compression details, it helps users identify bottlenecks and optimize their data models for enhanced performance.
Metrics in VertiPaq Analyzer:
The following are the metrics provided by the VertiPaq Analyzer offer critical insights into the structure, memory usage, and performance of your Power BI data models:
a) Name: This metric represents the name of the table or column being analyzed. This helps to identify where optimizations are needed.
b) Cardinality: This refers to the number of unique values in a column. The Lower cardinality is beneficial as it reduces memory usage and improves performance.
For example, a "Gender" column with only two unique values (Male, Female) will have low cardinality.
c) Total Size: It displays the total memory consumed by a table or column. This helps prioritize which tables or columns should be optimized.
Total Size = [Data Size] + [Dictionary Size] + [Hier Size]
d) Data: It Indicates the size of the actual data stored. Columns with high data size may need attention to reduce memory usage.
e) Dictionary: It shows size of a dictionary used for storing unique values. The larger dictionary indicates more unique values, which may impact compression efficiency.
f) Hier Size: It refers to the size of the automatically created hierarchies (like date hierarchies). The larger hierarchies can consume more memory.
g) Encoding: It details the compression method used, such as Value Encoding (for numeric and date data) or Hash Encoding (for text data). Efficient encoding methods lead to better compression and performance.
h) Data Type: It Identifies type of a data in a column, such as text, number, or date. Choosing the right data type is essential for optimizing storage and performance.
i) RI Violations (Referential Integrity Violations): This occur when relationships between tables are broken (e.g., a foreign key in one table has no matching value in the related table). These violations can lead to incorrect results and should be addressed.
j) User Hier Size: It represents the memory consumed by user-defined hierarchies, such as custom drill-down structures (e.g., Year → Quarter → Month). Optimizing these hierarchies can reduce memory usage.
k) Rel Size (Relationship Size): This metric represents the memory consumed by relationships between tables.
Tables with multiple relationships, especially those linked to large tables, can use a significant amount of memory.
Ensure relationships are necessary and avoid overly complex relationship structures in the model.
l) % Table: This Indicates the percentage of a column's memory usage relative to its table. The columns with high % Table values can be a focus for optimization.
Total Size (for a Table) = Data + Dictionary + Hier Size + Rel Size + User Hier Size
m) % DB (Data Model): It shows the percentage of memory a table consumes within the entire data model. This helps identify memory-heavy tables for review.
n) Columns: It represents the number of columns in a table. A high column count may indicate opportunities to reduce unused or redundant columns.
o) Partitions: The metric represents divisions of data within a table for improved performance. Partitioning is especially useful for large datasets as it allows for more efficient data retrieval.
p) Segments: This metric represents the Data in VertiPaq is stored in segments, which are the chunks of columnar data divided by row groups.
These segments allow for efficient storage and quick query processing, as only the relevant segments are accessed during calculations.
q) Pageable: This metric shows the Pageable data, that can be temporarily moved (or "paged out") from RAM to disk when it isn’t actively being used.
This feature helps to optimize memory usage by freeing up space for actively accessed data. However, retrieving paged-out data takes longer because it has to be reloaded into memory.
r) Resident: This metric shows the Resident data, is a data that remains in RAM Memory and is ready for immediate use.
Keeping frequently accessed data resident in memory ensures fast query responses, as there's no delay in loading the data.
s) Temperature: This metric indicates how frequently a segment of data is accessed and helps to prioritize which data should remain in memory for better performance.
Hot Data: Frequently used and should stay resident in memory.
Cold Data: Rarely used and can be paged out to optimize memory usage.
t) Last Accessed: This metric tracks the most recent time a segment of data was queried or used. Segments that haven't been accessed recently may be considered "cold" and could be paged out, while those accessed frequently should remain resident in memory.
Notes:
Why High %DB Can Occur Despite Low Cardinality: If a table shows high %DB even with low cardinality, it might be due to:
Large Row Count: Tables with many rows use significant memory regardless of cardinality.
High User Hier Size: Custom hierarchies may contribute heavily to memory usage.
Complex Relationships (Rel Size): Multiple or memory-intensive relationships increase the table size.
Excessive Columns: Each additional column adds to the total memory consumed.
Encoding Inefficiencies: Text columns with Hash Encoding can consume more memory than expected.
How to do the Vertipaq Analysis using DAX Studio:
We can follow the below steps to do the Vertipaq Analysis using DAX Studio.
1) Connect the Power BI Data Model to the DAX Studio:
We can connect to the local Power BI instance (which is opened in local) using Power BI / SSDT Model option.

When a Model is connected, we can see details of the Model objects under the Metadata tab.

Notes:
We can use the "Tabular Server" option to connect to a Power BI Data Model using the XMLA end point connection, from a Premium Workspace.
Example:
Workspace XMLA Endpoint: powerbi://api.powerbi.com/v1.0/myorg/WorkspaceName
Data Source=powerbi://api.powerbi.com/v1.0/myworkspace; Initial Catalog=MyDataset; Provider=MSOLAP;
2) Next go to Advanced and click View Metrics:
From the DAX Studio > Advanced option click on View Metrics to see information and metrics about the Data Model.

Next choose the default or specific options if required.

Read Statistics from Data: This option focuses on analyzing data stored in memory (import mode).
- Useful for import-mode datasets where data is preloaded into Power BI's in-memory model.
- Provides insights into column characteristics, such as cardinality and memory usage.
Read Statistics from Direct Query Tables: This option targets statistics for DirectQuery tables, which query external data sources at runtime rather than loading data into memory.
- Helps analyze query performance and table structure for models relying on external sources like SQL databases.
- Essential for optimizing models with DirectQuery connections.
DirectLake Scan Statistics from Data Options: This option controls how the data is scanned when retrieving statistics from a Data Model using Direct Lake Mode.
- Resident Only: Scans only the data that is already loaded in memory, offering a quick analysis.
- Reference: Includes data in memory and referenced columns used in measures or the relationships, providing a broader perspective without loading additional data.
- Full: Scans all columns, even those not in memory, by forcing them into memory. It is a thorough but resource intensive.
Larger batch sizes mean more rows are included in each segment, which can lead to better compression but might increase processing time.
- Smaller Batch Sizes: Provide more granular analysis, ideal for detailed troubleshooting.
- Larger Batch Sizes: Enable quicker analysis for large datasets but with less detail.
Metrics by Tables:


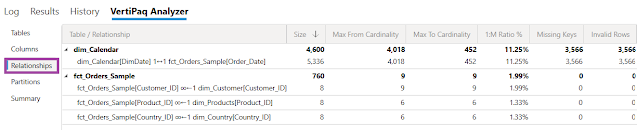
Metrics by Relationships:

Summary Metrics:
The Summary metric shows the information like Total Size of the Power BI Data Model, No. of Tables and Columns.

Notes:
How VertiPaq Metrics Relate to Total Size, %DB, and %Table:
The metrics Total Size, %DB, and %Table measures the memory usage and distribution. The metrics Segments, Pageable, Resident, Temperature, and Last Accessed provide insights into how this memory is being utilized or managed in real-time (e.g., what stays in RAM, what is paged out, and which data is frequently accessed).
Total Size, %DB, and %Table quantify memory consumption in your data model, while metrics like Segments, Pageable, Resident, Temperature, and Last Accessed provide insights into the real-time behavior and management of that memory.
By analyzing these metrics together, you can optimize your data model for better performance and memory efficiency.
1. Relation to Total Size:
The Total Size of a table or column is calculated as: Total Size = Data + Dictionary + Hier Size + Rel Size + User Hier Size.
- Segments: Data is divided into columnar segments (chunks based on row groups). The number and size of these segments directly impact the Data and Hier Size components of Total Size.
- Pageable and Resident: These metrics reflect whether data segments are stored in RAM (Resident) or temporarily moved to disk (Paged Out). Although paging out data doesn't change Total Size, it affects the availability and performance of data retrieval.
2. Relation to %DB:
The %DB represents the percentage of memory a table consumes relative to the entire data model.
- A table with many resident segments (data actively loaded into memory) may appear to consume a higher percentage of the data model’s memory.
- Temperature and Last Accessed metrics indicate how frequently segments of a table are accessed, which can influence how much of the table remains in memory.
- Tables with "hot" (frequently accessed) data may disproportionately affect %DB, even if their Total Size isn't the largest.
3. Relation to %Table:
The %Table is a percentage of memory a column consumes within its table.
- Segments: The size of each column's segments contributes to the memory used by the column, directly affecting its %Table value.
- Efficient segmentation (compression, low cardinality) leads to lower %Table, while larger, less compressed segments lead to higher values.
--------------------------------------------------------------------------------------------------------
Additional Notes:
If you are looking for the Power BI Best practices(rules) to improve the performance of your Data Model using Tabular Editor's Best Practice Analyze tool, you can refer the below article.https://powerbi.microsoft.com/en-us/blog/best-practice-rules-to-improve-your-models-performance/
This tool would suggest you the potential modeling missteps or changes which can be made to improve the model design and performance. This includes recommendations for naming, user experience and common optimizations that can be made to improve performance.
--------------------------------------------------------------------------------------------------------
Thanks, TAMATAM ; Business Intelligence & Analytics Professional
--------------------------------------------------------------------------------------------------------


No comments:
Post a Comment
Hi User, Thank You for visiting My Blog. If you wish, please share your genuine Feedback or comments only related to this Blog Posts. It is my humble request that, please do not post any Spam comments or Advertising kind of comments, which will be Ignored.