Scenario:
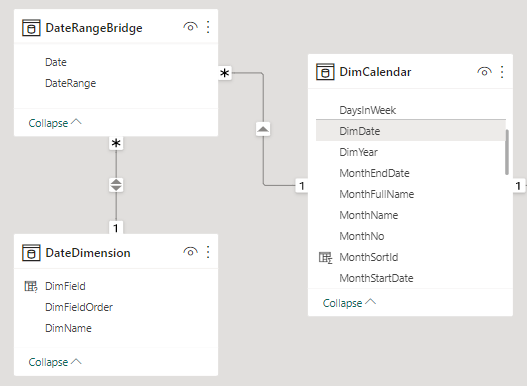
Suppose we have a Data Model as per below.


Requirement Criteria:
Case 1:
When user selected a Date Range of <=1 Month(say, 30 Days), then the X-Axis of the Visual should use the Date Dimension.
Case 2:
When user selected a Date Range of <=3 Months(say, 90 Days), then the X-Axis of the Visual should use the Week Dimension.
Case 3:
When user selected a Date Range of <=12 Months( Say , 365 Days), then X-Axis of the Visual should use the Month Dimension.
Case 3:
When user selected a Date Range of <=12 Months( Say , 365 Days), then X-Axis of the Visual should use the Month Dimension.
Case 4:
When user selected a Date Range of <=15 Months then X-Axis of the Visual should use the Quarter Dimension.
Case 5:
When user selected a Date Range of <=36 Months then X-Axis of the Visual should use the Year Dimension.
Note: You can define custom Date Ranges to Chose Dimension as per your requirement.
We can fulfil the above Criteria, as discussed below.
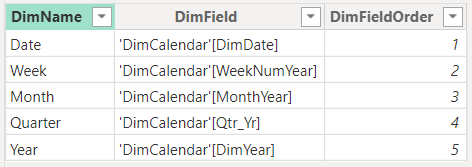
Step1: Create a Dynamic Date Dimension table using Field Parameters:
This Field Parameter table will be using for Dynamic X-Axis for the Visual.
DateDimension =
{
("Date", NAMEOF('DimCalendar'[DimDate]), 1),
("Week", NAMEOF('DimCalendar'[WeekNumYear]), 2),
("Month", NAMEOF('DimCalendar'[MonthYear]), 3),
("Quarter", NAMEOF('DimCalendar'[Qtr_Yr]), 4),
("Year", NAMEOF('DimCalendar'[DimYear]), 5)
}
Note: I have renamed Output Fields as per below:

Step2: Create a Bridge Table for Date Dimension:
This table will be used as a Bridge between DimCalendar and DateDimension.
DateRangeBridge =
ADDCOLUMNS(
CALENDAR(MIN(tbl_OrderDetails[Order_Date]), MAX(tbl_OrderDetails[Order_Date])),
"DateRange",
VAR vMonthCount = DATEDIFF(MIN(tbl_OrderDetails[Order_Date]),[Date], MONTH)+1
RETURN
SWITCH(TRUE(),
vMonthCount = 1, 1, --Date
vMonthCount <= 3, 2, --Week
vMonthCount <= 12, 3, --Month
vMonthCount <= 15, 4, --Quarter
vMonthCount <= 36, 5 --Year
)
)
Step3: Enable the required relationships between DimCalendar, DateRangeBridge and Date Dimension:
The One to Many relationship between DimCalendar (1:M) DateRangeBridge with Cross Filter direction Single.
The One to Many relationship between DateDimension (1:M) DateRangeBridge with a Cross Filter direction Both.

Step4: Build a Column/Bar Chart with use of DateDimension[DimName] on the X-Axis:
The Dynamic Date Dimension Slicer is based on DateDimension[DimName], which is Optional as the Date Diemension is enough to update the X-Axis based on a range of Dates selected.

 Results:


Case 1:
When user selected a Date Range of <=1 Month(say, 30 Days), then the X-Axis of the Visual should use the Date Dimension.
Case 2:
When user selected a Date Range of <=3 Months(say, 90 Days), then the X-Axis of the Visual should use the Week Dimension.
Case 3:
When user selected a Date Range of <=12 Months( Say , 365 Days), then X-Axis of the Visual should use the Month Dimension.
Case 4:
When user selected a Date Range of <=15 Months then X-Axis of the Visual should use the Quarter Dimension.
Case 5:
When user selected a Date Range of <=36 Months then X-Axis of the Visual should use the Year Dimension.
--------------------------------------------------------------------------------------------------------
Thanks, TAMATAM ; Business Intelligence & Analytics Professional
--------------------------------------------------------------------------------------------------------


No comments:
Post a Comment
Hi User, Thank You for visiting My Blog. If you wish, please share your genuine Feedback or comments only related to this Blog Posts. It is my humble request that, please do not post any Spam comments or Advertising kind of comments, which will be Ignored.