Scenario:
Suppose we have a Data Model as follows.

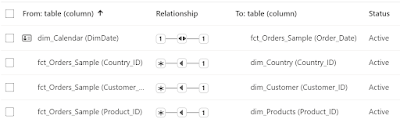
From this Data Model we need to compare the Sales of Products against a Selected Product.

We can achieve this Scenario as explained below:
1) Create a Slicer Table with unique list of Products:
We need to create a separate Slicer table dim_ProdList from dim_Products, which will be disconnected from the Data Model.
Net Sales = Sum(fct_Orders_Sample[Net_Sales])
dim_ProdList =
SELECTCOLUMNS(
dim_Products,"Prod_Id",
dim_Products[Product_ID],
"Prod_Name", dim_Products[Product_Name]
)
We need to calculate the Product sales based on the selected (and Non-Selected) Product from dim_ProdList as defined below.
Selected Prod_ID = SELECTEDVALUE(dim_ProdList[Prod_Id])
Non Selected Prod Sales =
VAR _SelProd = [Selected Prod_ID]
VAR _Prod_Sales =
CALCULATE( [Net Sales],
KEEPFILTERS(dim_Products[Product_ID]<> _SelProd)
)
RETURN
_Prod_Sales
Selected Prod Sales =
VAR _SalesFlag = IF ( NOT ISBLANK([Non Selected Prod Sales]),1,0)
VAR _Prod_Sales =
CALCULATE( [Net Sales],
TREATAS( VALUES(dim_ProdList[Prod_Id]),
dim_Products[Product_ID]),
ALL(dim_Products)
)
RETURN
IF( _SalesFlag=1, _Prod_Sales)
The following dynamic Title string will be used for the Visual.
Selected Prod_Name = SELECTEDVALUE(dim_ProdList[Prod_Name])
3) Build a visual using Line and Clustered Column Chart:
Finally, we need to build a visual using the Line and Clustered Column Chart (Combo Chart) with dim_Products[Product_Name] on X-Axis, [Non Selected Prod Sales] on Y-Axis, [Selected Prod Sales] on Line Y-Axis as shown below.
The Product slicer need to be considered from dim_ProdList[Product_Name]

Result:

--------------------------------------------------------------------------------------------------------
Thanks, TAMATAM ; Business Intelligence & Analytics Professional
--------------------------------------------------------------------------------------------------------


No comments:
Post a Comment
Hi User, Thank You for visiting My Blog. If you wish, please share your genuine Feedback or comments only related to this Blog Posts. It is my humble request that, please do not post any Spam comments or Advertising kind of comments, which will be Ignored.