How to Analyze and Identify the returning Loyal Customers with SQL in SQL Server
Scenario:
Suppose there is Retail Store, where the Business Owner wants to Identify the how many Customers are frequently buying from the Store each Month, till the Year End.
The Customers who are buying from the Store in the initial First 3 Months will be Flagged as "Base Customers".
Any Customers who started visiting the Store after Initial 3 Months ( between M4 to M12) will be flagged as "New Customers".

The following query shows the All(Inclusive of Base) Customers Visit(Buy) Detail By Month.
Select *, Lead(Mth_Visit,1) Over (Partition BY Cust_Id ORDER BY Cust_Id,Mth_Visit) Leading_Mth_Visit,
Select * From @@Cust_Visit_Lapse_Log
In the fourth record, the "Mth_Visit_Lagging" is shown as "4", since the Mth_Visit "12" is the Lagging Month behind the "4" for the same Customer.

Next the following query shows the details of Retained Customers, who frequently Visited the Store:


Scenario:
Suppose there is Retail Store, where the Business Owner wants to Identify the how many Customers are frequently buying from the Store each Month, till the Year End.
The Customers who are buying from the Store in the initial First 3 Months will be Flagged as "Base Customers".
Any Customers who started visiting the Store after Initial 3 Months ( between M4 to M12) will be flagged as "New Customers".
The Customers who buys from the Store frequently( Visits like M1, M2, M3, M4..M11, M12), which means they are continuously buying from the Store each Month will be Flagged as the "Retained Customers".
The Customers who buys from the Store less frequently( Visits like M1, M3, M4, M6..M10, M12 ), which means they are not continuously visiting the Store each Month will be Flagged as the "Lagged Customers".
The Customers who visits the Store continuously(or not) but stopped visiting the before M11 , which means they are not continuing till the Year End will be Flagged as "Lost Customers".
Please note that, the "Base Customers" can be a "Retained/Lagged/Lost" Customer at any point of time based on their Visits to the Store.
At the end of the Fiscal Year, the Business wants to Award the "Loyal Customers" who will be Retained with their Store as "Retained Customers", with Most frequent Visits.
We can fulfill the above Scenario of the Business Owner, by Implementing the Logics using SQL Server, as explained in below example
Example :
Use AnalyticsDB
GO
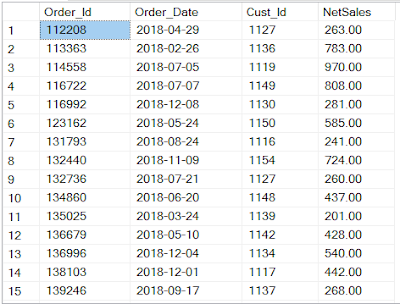
Suppose we have Table of data with Customers and their Order details for the Fiscal Year 2018. I have just shown a sample of 15 records out of 366 rows.
Select Distinct * From [dbo].[Customer_Orders]
The Customers who buys from the Store less frequently( Visits like M1, M3, M4, M6..M10, M12 ), which means they are not continuously visiting the Store each Month will be Flagged as the "Lagged Customers".
The Customers who visits the Store continuously(or not) but stopped visiting the before M11 , which means they are not continuing till the Year End will be Flagged as "Lost Customers".
Please note that, the "Base Customers" can be a "Retained/Lagged/Lost" Customer at any point of time based on their Visits to the Store.
At the end of the Fiscal Year, the Business wants to Award the "Loyal Customers" who will be Retained with their Store as "Retained Customers", with Most frequent Visits.
We can fulfill the above Scenario of the Business Owner, by Implementing the Logics using SQL Server, as explained in below example
Example :
Use AnalyticsDB
GO
Suppose we have Table of data with Customers and their Order details for the Fiscal Year 2018. I have just shown a sample of 15 records out of 366 rows.
Select Distinct * From [dbo].[Customer_Orders]

Defining the Tables required for Customer Retention Analysis
Declare @@Base_Customers As Table (Cust_Id Int)
Declare @@Cust_Visit_Summary As Table (FY Int, Mth Int, Cust_Visit_Cnt Int, NetSales Money)
Declare @@Cust_Visit_Log As Table ( Cust_Id Int, Mth_Visit Int, NetSales Money)
Declare @@Cust_Visit_Lapse_Log As Table ( Cust_Id Int, Mth_Visit Int, NetSales Money, Leading_Mth_Visit Int,Mth_Visit_Lagging Int)
Updating the @@Base_Customers Table with Customer Ids who Buys from the Store in the Initial 3 Months
Insert Into @@Base_Customers (Cust_Id)
( Select Distinct Cust_Id From [dbo].[Customer_Orders]
Where Month([Order_Date]) In (1,2,3)
)
Select * From @@Base_Customers
There were 35 Customers have been Identified as Base Customers from the Store, who Buys in the initial 3 Months. But I have shown only 15 Customers here.

I have shown only 15 records out of 266 rows:

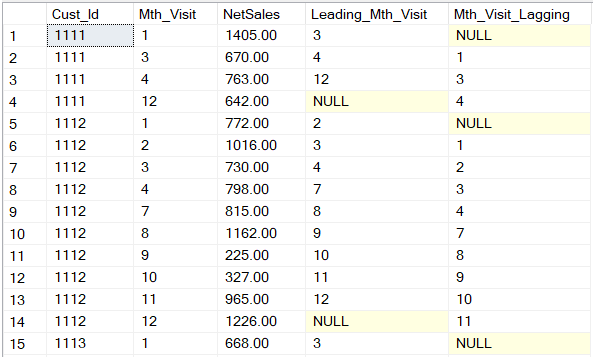
 Next the following query shows the All(Inclusive of Base) Customers Visit(Buy) by the Month , and the Leading and Lagging Months details :
Insert Into @@Cust_Visit_Lapse_Log
Insert Into @@Cust_Visit_Log (Cust_Id, Mth_Visit, NetSales)
( Select Distinct Cust_Id,Month(Order_Date) Visit_Month, Sum(NetSales) NetSales
From [dbo].[Customer_Orders]
Group By Cust_Id,Month(Order_Date)
)
Select * From @@Cust_Visit_Log
( Select Distinct Cust_Id,Month(Order_Date) Visit_Month, Sum(NetSales) NetSales
From [dbo].[Customer_Orders]
Group By Cust_Id,Month(Order_Date)
)
Select * From @@Cust_Visit_Log

Next the following query shows the All(Inclusive of Base) Customers Visit(Buy) Summary by the Month:
Insert Into @@Cust_Visit_Summary
Select Year([Order_Date]) FY,
Month([Order_Date]) Mth, Count(Distinct Cust_Id) Cust_Visit_Cnt,
Sum([NetSales]) NetSales
From [dbo].[Customer_Orders]
Group By Year([Order_Date]) , Month([Order_Date])
Select * From @@Cust_Visit_Summary
Select Year([Order_Date]) FY,
Month([Order_Date]) Mth, Count(Distinct Cust_Id) Cust_Visit_Cnt,
Sum([NetSales]) NetSales
From [dbo].[Customer_Orders]
Group By Year([Order_Date]) , Month([Order_Date])
Select * From @@Cust_Visit_Summary

Select *, Lead(Mth_Visit,1) Over (Partition BY Cust_Id ORDER BY Cust_Id,Mth_Visit) Leading_Mth_Visit,
Lag(Mth_Visit,1) Over (Partition BY Cust_Id ORDER BY Cust_Id,Mth_Visit)
Mth_Visit_Lagging
From @@Cust_Visit_Log
Mth_Visit_Lagging
From @@Cust_Visit_Log
Select * From @@Cust_Visit_Lapse_Log

Notes :
Leading_Mth_Visit :
In the first record, the Visit Month of the Cust_Id "1111" is "1", then the "Leading_Mth_Visit" will show the Next Visit Month of that Customer which is "3" that Leading by "1".
In the fourth record, the Leading_Mth_Visit is shown as "NULL" as the Mth_Visit "12" is not Leading any further Month values for the same customer.
Mth_Visit_Lagging :
In the first record, the Visit Month of the Cust_Id "1111" is "1", then the "Mth_Visit_Lagging" will shown as "NULL", since the Visit Month "1" is not Lagging behind any Month values for that Customer.In the fourth record, the "Mth_Visit_Lagging" is shown as "4", since the Mth_Visit "12" is the Lagging Month behind the "4" for the same Customer.
The above Section is very Important in our Customer Retention Analysis. The Lead and Lag are the two Analytical Functions provided by the SQL Server.
Next the following query shows the details of Gap/Lapse(in Months) in the Customer visit to the Store and the Categorization of Customer.I have shown here only the 35 records out of 266 rows:
IF OBJECT_ID('[tempdb].[dbo].[#CustRetentionAnalysis]', 'U') IS NOT NULL
Begin
DROP TABLE [dbo].[#CustRetentionAnalysis]
End
Select * Into [dbo].[#CustRetentionAnalysis]
From (
Select *, Case When [Mth_Visit_Lagging] IS NULL Then ([Leading_Mth_Visit]-[Mth_Visit])
Else ([Mth_Visit]-[Mth_Visit_Lagging])
End As [Lapse_in_Visit],
Begin
DROP TABLE [dbo].[#CustRetentionAnalysis]
End
Select * Into [dbo].[#CustRetentionAnalysis]
From (
Select *, Case When [Mth_Visit_Lagging] IS NULL Then ([Leading_Mth_Visit]-[Mth_Visit])
Else ([Mth_Visit]-[Mth_Visit_Lagging])
End As [Lapse_in_Visit],
(Case When [Mth_Visit] In (1,2,3) Then 'Base_Cust'
When [Mth_Visit] Not In (1,2,3) And (Mth_Visit-[Mth_Visit_Lagging]) IS NULL
Then 'New_Cust'
When [Mth_Visit] <11 And [Leading_Mth_Visit] IS NULL Then 'Cust_Lost'
When ([Mth_Visit]-[Mth_Visit_Lagging] =1) And
([Leading_Mth_Visit]-[Mth_Visit] =1 OR [Mth_Visit]-[Mth_Visit_Lagging] =1)
Then 'Retained_Cust'
When ([Leading_Mth_Visit]-[Mth_Visit] >1 OR [Mth_Visit]-[Mth_Visit_Lagging] >1)
Then 'Lagged_Cust'
End ) As Cust_Type
From @@Cust_Visit_Lapse_Log
) S1 Order by 1, 2
Select * From [dbo].[#CustRetentionAnalysis]

IF OBJECT_ID('[tempdb].[dbo].[#LoyalCustomers]', 'U') IS NOT NULL
Begin
DROP TABLE [dbo].[#LoyalCustomers]
End
Select S1.* Into [dbo].[#LoyalCustomers]
From
(
Select TOP(1000000000) [Cust_Id], [Cust_Type] , Sum([NetSales]) NetSales,
Count(Cust_Type) [Cust_Type_Freq]
From [dbo].[#CustRetentionAnalysis]
Where [Cust_Type]= 'Retained_Cust'
Group By [Cust_Id],[Cust_Type]
Having Count([Cust_Type]) >1
Order By NetSales Desc ,Cust_Type_Freq Desc
) S1
Select * From [dbo].[#LoyalCustomers]
Note : In the above query, I have used the Top () Clause only to enable the Order By in the Sub Query result.

Finally from the above Retained Customers(Loyal Customers), we select the few Customers to Award them based on their Retainability Score (i.e, Cust_Type_Freq) and the NetSales generated from them:
IF OBJECT_ID('[tempdb].[dbo].[#LoyalCustomers_Awarded]', 'U') IS NOT NULL
Begin
DROP TABLE [dbo].[#LoyalCustomers_Awarded]
End
Select * Into [dbo].[#LoyalCustomers_Awarded]
From (
Select Cust_Id, Cust_Type, NetSales,'Loyal Customers' As [Award Type]
From [dbo].[#LoyalCustomers]
Where [Cust_Type_Freq]
IN ( Select Distinct Top (3) [Cust_Type_Freq] From [dbo].[#LoyalCustomers]
Order By Cust_Type_Freq Desc )
) S1
Select * From [dbo].[#LoyalCustomers_Awarded]

Note :
You can use this Analytical Method to apply differently in your Business Scenario.
Please post your valuable Feedback on this Article.
--------------------------------------------------------------------------------------------------------
Thanks, TAMATAM ; Business Intelligence & Analytics Professional
--------------------------------------------------------------------------------------------------------